Making Predictions
You make a prediction simply by sliding the slider on the question's page to the probability you believe most captures the likelihood that the event will occur.
You can revise your prediction at any time up until the question closes, and you are encouraged to do so: as new information comes to light, it is beneficial to take it into account.
You're also encouraged to predict early, and you are awarded bonus points for being among the earliest predictors.
Range Interface
Some Metaculus questions allow numeric or date range inputs, where you specify the distribution of probability you think is likely over a possible range of outcomes. This probability distribution is known as a probability density function and is the probability per unit of length. The probability density function can be used to determine the probability of a value falling within a range of values.
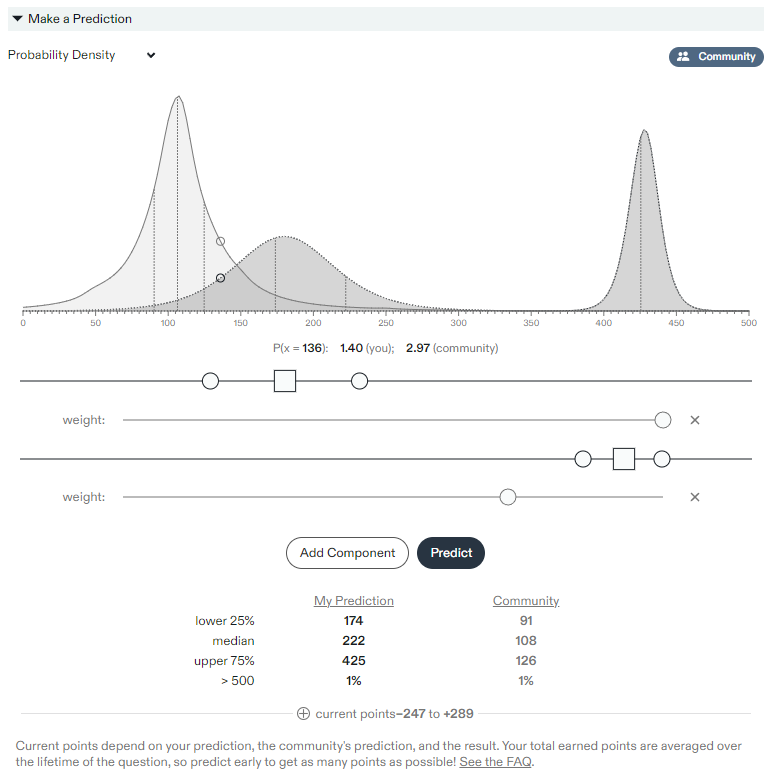
When you hover over the chart you see the probabilities at each point at the bottom of the chart. For example, in the image below you can see the point probability at the value 136, denoted by “P(x = 136)”, and you can see the probability that you and the community have assigned to that point (in the image the user has assigned a probability of 1.40 to that value and the community has assigned a probability of 2.97).
By selecting the “Probability Density” dropdown at the top of the chart you can change the display to “Cumulative Probability”. This display shows the cumulative distribution function, or in other words for any point it shows you the probability that you and the community have assigned to the question resolving below the indicated value. For example, in the image below you can see the probability that you and the community have assigned to the question resolving below the value of 136, denoted by “P(x < 136)”. The probability that the user has assigned is 7% to the question resolving below that value, while the community has assigned an 83% chance to the question resolving below that value.
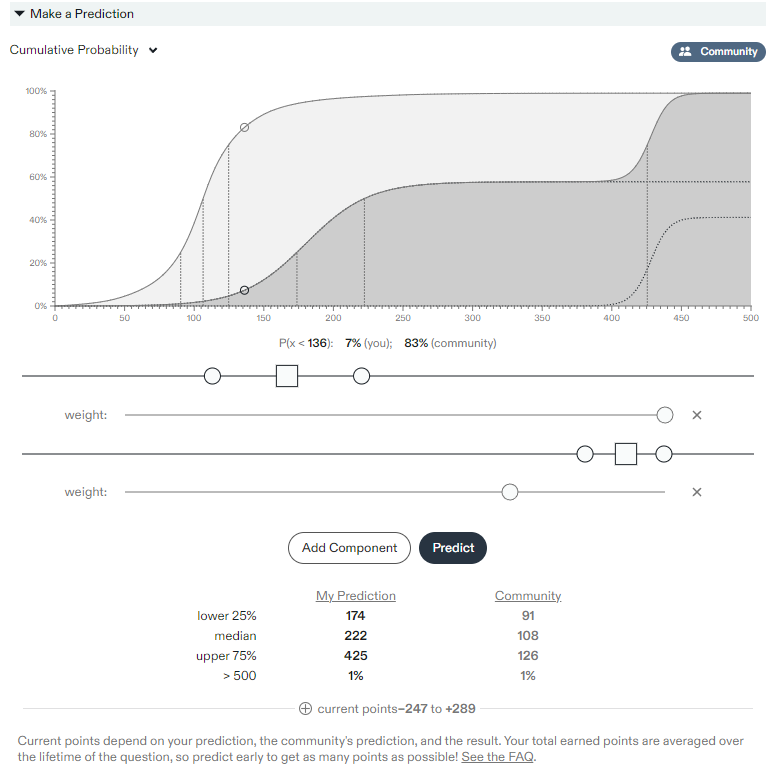
The vertical lines shown on the graphs indicate the 25th percentile, median, and 75th percentile forecasts, respectively, of the user and the community. These values are also shown for the user and the community in the table at the bottom.
Out of Bounds Resolution
In the table showing the predictions at the bottom of the images above, you will see that in addition to the 25th percentile, median, and 75th percentile probabilities there is also one labeled "> 500". This question has an open upper bound, which means forecasters can assign a probability that the question will resolve as a value above the upper end of the specified range. For the question depicted above the community and the forecaster each assign a 1% probability to the question resolving above the upper boundary.
Questions can have open or closed boundaries on either end of the specified range.
Closed Boundaries
A closed boundary means forecasters are restricted from assigning a probability beyond the specified range. Closed boundaries are appropriate when a question cannot resolve outside the range. For example, a question asking what share of the vote a candidate will get with a range from 0 to 100 should have closed boundaries because it is not possible for the question to resolve outside the range. Closed boundaries restrict forecasters from assigning probabilities outside the specified range.
Open Boundaries
An open boundary allows a question to resolve outside the range. For example, a question asking what share of the vote a candidate will get with a range from 30 to 70 should have open boundaries because it is possible that the candidate could get less than 30% of the vote or more than 70%. Open boundaries should be specified even if it unlikely that the vote share falls outside the range, because it is theoretically possible that vote shares outside the specified range can occur.
Forecasters can assign probabilities outside the range when the boundary is open by moving the slider all the way to one side. The weight can also be lowered or increased to adjust the probability assigned to an out of bounds resolution.
Multiple Components
In the images shown above you can see that the user has assigned two probability distributions. Up to five logistic distributions can be added using the “Add Component” button. The relative weight of each can be adjusted using the “weight” slider below each component.
Asymmetric Predictions
The probability distributions can be entered asymmetrically by dragging one side of the distribution slider. On desktop computers users can hold the shift key while dragging a slider to force the distribution to be symmetric.